| Author |
 Topic Topic  |
|
|
ptero
Silver Member

Mexico
218 Posts |
 Posted - 02/04/2007 : 03:07:25 Posted - 02/04/2007 : 03:07:25


|
Playing with a Spectrum Analyzer software and some Boss pedals...
Here you are some images of PH-3 and BF-3's effects on spectrum of the signal.
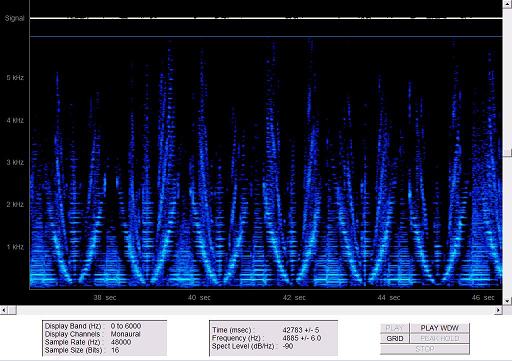
Download Attachment:  PH-3 Spectrum A.JPG PH-3 Spectrum A.JPG
39.07 KB
PH-3 Rate 12, Depth Max, Res Max, Stage 4
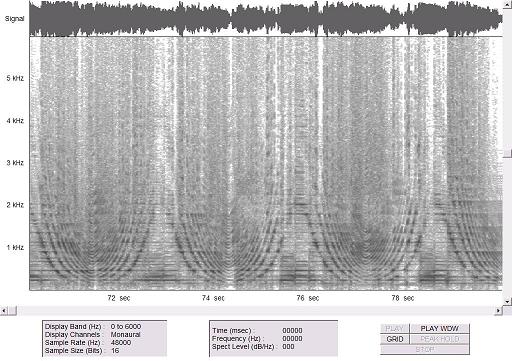
Download Attachment: BF-3 Spectrum A.JPG
45.92 KB
BF-3 Res Max, Manual Min, Depth Max, Rate 12, Mode Standard
 |
|
|
Dr. Bob
Moderator

Australia
6593 Posts |
Posted - 02/04/2007 : 05:03:54
|
Hi Ptero
What was the signal source? A chord on your guitar? which one?
Can you please upload a pic, showing just a 1KHz, or whatever signal as a comparison, 
at the same 100mV or so, or at the same level, as the guitars output.
The top blue pic shows the Freq. at 4885 +/-0.6Hz, what was the signal?
The signal coming from a guitar can be harmonically complex.
Regards Dr. Bob 
|
 |
|
|
DeFrag
Moderator
USA
3409 Posts |
Posted - 02/04/2007 : 05:10:25
|
| Friggin' awesome! I've been wanting to purchase an oscilliscope to set above my pedals to monitor the output & compare waveforms. What software are you using & what inputs does it require? I've been looking at http://www.bitscope.com. I also want a Huuuge VU meter in a custom box with maybe a sensitivity knob to connect to my mixer main outputs. I dunno interesting I suppose.. |
|
|
|
ptero
Silver Member
Mexico
218 Posts |
Posted - 02/04/2007 : 07:29:21
|
Hi Dr. Bob, DeFrag
The signal source was my guitar playing a chord, Am or D, I don't remember, but you wouldn't recognize the chord by watching that graph. As you said, it is harmonically complex, very complex. The frecuency that appears in the firt graph was just the position of the cursor on the screen, is meaningless.
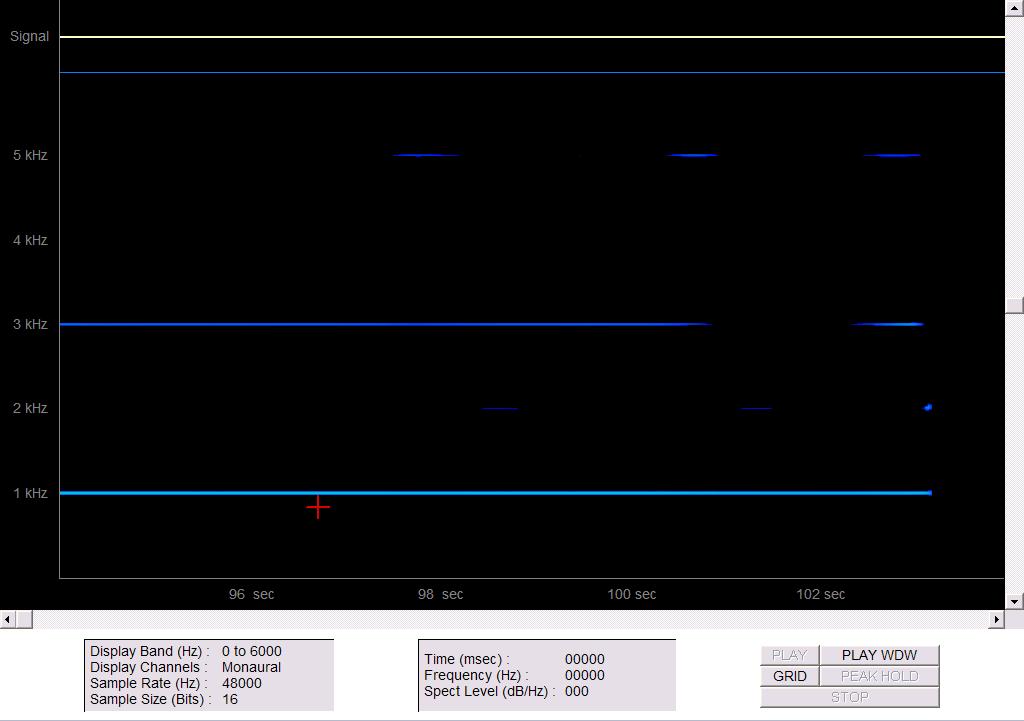
I don't have a function generator or whatever that help with the 1kHz signal, not right now. Let me check for a software or something in the web. Instead of that, here is a guitar signal using an E-bow sustaining an harmonic at the B string's 24th fret.
Download Attachment: Harmonic_with_ebow.JPG
49.46�KB
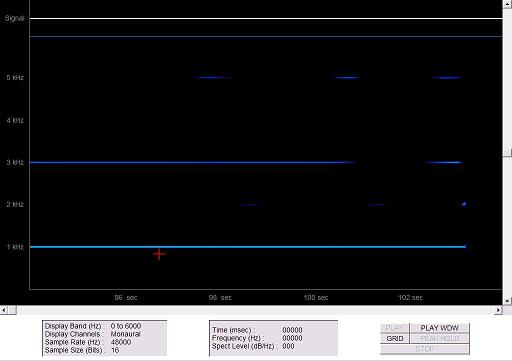
As you can see, the signal is about at 1kHz, it has a subharmonic at 3Khz, and sometimes it shows two slight subharmonics at 2kHz and 5 kHz.
I download a free trial version of the software at this link:
http://www.dxzone.com/catalog/Software/Spectrum_analyzers/
DeFrag, go to the Spectrogram link, I choosed that one. It uses your computer's mic input. All you have to do is to plug your guitar instead of the microphone.
To have an oscilloscope, why didn't I put that in my list for Santa? Wait... The complete Boss pedal collection, that's why. |
Edited by - ptero on 02/04/2007 07:32:31 |
|
|
|
bossarea
Forum Admin

United Kingdom
3652 Posts |
Posted - 02/04/2007 : 10:32:46
|
Great work but I'm not sure it tells me a lot. Maybe I'm just thick  The last picture is clear enough. There you can see the different frequency componnets but the first two are harder to interpret. The last picture is clear enough. There you can see the different frequency componnets but the first two are harder to interpret.
What I think would be more interesting is to test the different distortion pedals under an analyzer. You would then be able to brake down the harmonics added to the original signal and measure exactly how the distortion is built up. |
|
|
|
guirat
Silver Member
United Kingdom
186 Posts |
Posted - 02/04/2007 : 15:07:45
|
That looks like very interesting software, I wonder if it could be employed when building pedals, by that I mean seeing how the graph changes as you swap out components. Maybe it's more to do with sound waves than component values but it might help show levels that are too high (distorting)?
Well, that's beyond me at the moment, but I did get another idea - that first picture would make a great design for a pedal case, a pictorial representation on the outside of what the components are doing inside. |
|
|
|
Dr. Bob
Moderator
Australia
6593 Posts |
Posted - 02/04/2007 : 15:14:07
|
quote:
Originally posted by guirat
Well, that's beyond me at the moment, but I did get another idea - that first picture would make a great design for a pedal case, a pictorial representation on the outside of what the components are doing inside.
Hi guirat.
Great Idea, maybe jack (on this forum) will see this.
Regards Dr. Bob |
|
|
|
ptero
Silver Member
Mexico
218 Posts |
Posted - 02/04/2007 : 20:02:04
|
I know the first two images are very hard to interpret, but they look very cool!!
Well, the analyzer works in this way, if there is no signal the screen will be all black. When a signal appears in the input, its harmonics are displayed on the screen at their respectives frecuencies. The level of the harmonic is denoted by the color.
In the second graph I used other color pallete, white is for no signal and black for signal.
The horizontal axis is the time, as you play something it appears in the right side of the screen and it is scrolled to the left until disappear.
Now, in the phaser graph I was playing a chord which is full of harmonics. The bottom is the low end and the top is the high end, so the harmonics at low end are greater in level. Back to phaser thing, these, I don't know, "parabolic marks" are made by the phaser sweep, if you change the rate they will be more narrow or wider. Where the harmonics are supressed it shows a black area, where they are boosted, a brighter area. The flanger graph is similar.
About analyzing distortion pedals, yeah is very interesting. I did that with my XT-2 and the added harmonics where shown on the screen. Unfortunately, I only have a XT-2 and a MT-2, if you have a setting suggestion for these pedals to check in the analyzer, tell me, ok?? |
Edited by - ptero on 02/04/2007 20:20:05 |
|
|
|
Dr. Bob
Moderator
Australia
6593 Posts |
Posted - 02/05/2007 : 07:37:58
|
Hi Guys
I think we are all missing the point here....
The display of a spectrum analyzer is a dynamic thing,
It's best viewed as a moving-changing display.
The harmonic content of a guitar signal is ever changing with time.
Don't think, that I don't appreciate all the effort that ptero, went to, to post his findings.
It's just that I believe, that we would make more sense of the results
if they were done as a movie clip.
I also know, that there are times, when all is need it a static pic of a certain set of conditions.
But to expand, on what I said above, a Phaser, delay, flanger, chorus, are effects, that are all time dependent,
And I think, that is why it's difficult for us to make sense of the static pic, that ptero uploaded.
Ptero, none of this is meant to be insulting in any way, it's just a lot of people, have never & will never, use a Spectrum Analyzer.
I hope you did not take any offense?
And, I would really like to see a movie clip of the phaser or chorus.
Regards Dr. Bob
|
|
|
|
ptero
Silver Member
Mexico
218 Posts |
Posted - 02/07/2007 : 05:04:43
|
quote:
Originally posted by Dr. Bob
I hope you did not take any offense?
And, I would really like to see a movie clip of the phaser or chorus.
Regards Dr. Bob
No offense taken.
Still thinking how to create the movie clip, and then, where to upload it. |
|
|
| |
Topic |
|
|
|
 Harmonic_with_ebow.JPG